2022 Top Manufacturers Report
Manufacturers mark another year of growth and increased demand while navigating material and labor constraints
Photo above courtesy of Van Isle Windows
Greatest Opportunities for the Year Ahead
- Internet sales
- Remodeling
- Geographic expansion
- Technology and automation
- Product growth
- Reduced lead times
- Large projects
- Energy efficiency
Source: 2022 Window + Door Top Manufacturers Survey
Headlines and reports from the past year have made it easy to focus on the challenges in the overall economy and hardships in the construction products market specifically. From worsening supply chain complications to rapidly rising inflation to fallout from the ongoing Ukraine-Russia war, many factors have negatively impacted the market. Within those hardships, however, lies plenty of opportunity for manufacturers to expand business and continue to innovate.
As the 2022 Industry Pulse, published in the January-February issue of Window + Door, said, this is the year when companies are finally starting to work on their businesses again, rather than just in their businesses. Labor, costs, materials and supply chain might be hard, but rather than merely “getting by,” many companies are navigating these challenges while actively growing and best meeting their customers’ evolving needs. Window + Door’s Top Manufacturers Report, presented in the coming pages, supports this sentiment.
This year’s report examines the market, pain points and product trends with commentary from manufacturers about how they are expanding in today’s conditions while mitigating challenges.
The 2022 Top Manufacturers Report
- Part 1 | The Big Picture
New home construction, remodeling and manufacturing outlooks- Part 2 | A Look at Residential Fenestration
Market conditions, labor and automation, materials, supply chain and products- The Top Manufacturers Index + List
North America’s largest manufacturers of residential windows, doors, skylights and related products, based on sales volume
The May/June Digital Issue
More details about each of the 2022 Top Manufacturers on the List are available in the May/June digital issue of Window + Door Magazine along with more of their survey results.

The Big Picture
Despite operating in a niche market, it’s important that residential fenestration manufacturers take stock of the building market as a whole to best understand where window and door products fit in and what overall building trends are affecting the market.
New Home Construction
Sales of newly built single-family homes in March fell 8.6 percent to a 763,000 seasonally adjusted rate from an upwardly revised reading in February, according to the U.S. Department of Housing and Urban Development and the U.S. Census Bureau. New home sales are down 12.6 percent compared to March 2021.
“Buyers are facing sticker shock due to deteriorating affordability conditions and a lack of existing home inventory,” says Danushka Nanayakkara-Skillington, NAHB assistant vice president of forecasting and analysis. “Only 14 percent of new home sales in March were priced below $300,000. A year ago, it was 34 percent.” The median sales price rose to $436,700 in March from $421,600 in February and is up more than 21 percent compared to a year ago, due primarily to higher development costs.
Those higher costs, which include rising interest rates and higher construction costs, continue to deteriorate builder confidence and housing affordability. Builder confidence in the market for newly built, single-family homes declined in April for the fourth consecutive month, according to the National Association of Home Builders/Wells Fargo Housing Market Index.
“Despite low existing inventory, builders report sales traffic and current sales conditions have declined to their lowest points since last summer as a sharp jump in mortgage rates and persistent supply chain disruptions continue to unsettle the housing market,” says Jerry Konter, NAHB chairman.
“The housing market faces an inflection point as an unexpectedly quick rise in interest rates, rising home prices and escalating material costs have significantly decreased housing affordability conditions, particularly in the crucial entry-level market,” says Robert Dietz, NAHB chief economist.
Mortgage interest rates have jumped more than 1.9 percentage points since the start of the year and currently stand at 5 percent, the highest level in more than a decade.
Remodeling
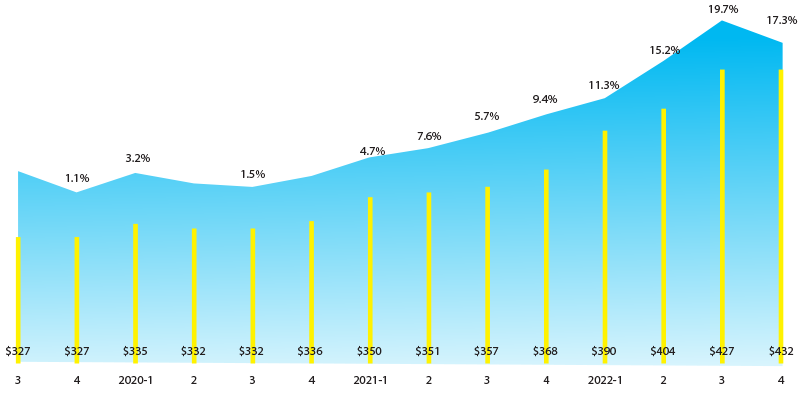
Spending for home improvements and repairs is expected to expand at a stronger pace in 2022, but signs point to some easing of growth by year end, according to the latest Leading Indicator of Remodeling Activity from the Joint Center for Housing Studies of Harvard University. The LIRA projects double-digit gains in annual homeowner renovation and maintenance expenditure will top out in the third quarter of 2022 before beginning a deceleration toward more sustainable rates of growth.
While annual owner improvement and repair spending could reach $430 billion by the second half of 2022, several headwinds may still temper growth expectations this year, including rising costs of labor and construction materials, difficulty retaining contractors and climbing interest rates.
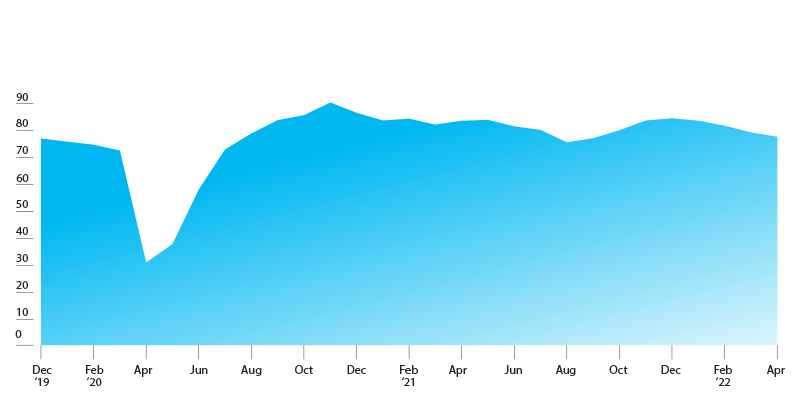
Strong remodeling conditions continue to boost remodeler confidence, according to the first quarter National Association of Home Builders/Westlake Royal Remodeling Market Index.
“Business remains strong for most remodelers at the beginning of 2022,” says Kurt Clason, NAHB Remodelers chair. “However, a few are starting to report that customers are reluctant to move forward on projects due to the delays and higher costs caused by supply chain problems.”
The most recent RMI score of 86 indicates “positive remodeler sentiment and is consistent with NAHB’s projection of moderate growth in the remodeling market for 2022,” says Dietz.

Manufacturing
Nearly 89 percent of the overall manufacturing industry is positive about their companies’ outlook, according to the National Association of Manufacturers’ Outlook Survey for the First Quarter of 2022.
A further breakdown of survey findings revealed:
- Expected growth rate for sales over next 12 months: 6.1 percent
- Expected growth rate for full-time employment over next 12 months: 3.7 percent
- Expected growth rate for production over next 12 months: 5.6 percent
- Expected growth rate for prices of company’s products over next 12 months: 6.1 percent (record high)
- Expected growth rate for inventories over next 12 months: 2.4 percent
- Expected growth rate for raw material prices and other input costs over next 12 months: 7.1 percent
Labor concerns in manufacturing will remain a concern for the rest of the decade.
According to a study by Deloitte and The Manufacturing Institute, 2.1 million manufacturing jobs could go unfilled by 2030, which could cost $1 trillion in 2030 alone. An estimated 1.4 million manufacturing jobs were lost during the early days of the COVID-19 pandemic, setting the industry back by more than a decade. Executives report trouble filling higher-paying entry-level production positions, let alone finding and retaining skilled workers for specialized roles.
DEI initiatives can exert a growing influence on workforce trends, according to the report. “Attracting and retaining diverse talent presents both a challenge and solution to bridging the talent gap. To attract a new generation of workers, the industry should work together to change the perception of work in manufacturing and expand and diversify its talent pipeline,” says Paul Wellener, Deloitte vice chairman and U.S. industrial products and construction leader.
Price Increases
Nearly all (93 percent) of professional contractors reported increased material costs in the past six months, with an average hike of 19 percent, according to research from the Home Improvement Research Institute.
Here’s how contractors responded:
- 55 percent raised prices and absorbed increases
- 16 percent absorbed all price increases
- 29 percent passed all price increases to customers
- 57 percent lost bids due to price increases
The majority of pros expect prices will be even higher in six months, but the current high demand for contractors also means they aren’t yet concerned about losing jobs.
Market Conditions
95%
Report measurable, significant growth over the past five years
87%
Report higher gross sales in 2021 compared to 2020
98%
Report increased demand compared to last year
A Look at Residential Fenestration
The Window + Door Top Manufacturers survey, conducted in late March and early April 2022, took stock of residential fenestration manufacturers of all sizes across North America. Nearly all respondents cited increased demand and sales, and most expect that trend to continue even as pressure related to materials, labor and supply challenges increases.
Market Conditions
Growth methods
- Hired employees: 84%
- Gained market share: 79%
- Expanded product lines: 73%
- Expanded geographic sales areas: 50%
- Acquired other companies: 18%
- Other: 9% (includes organic growth, increased production and new product launches)
Unpredictability in material availability; rising material costs, often with little to no notice; long lead times and labor continue to plague most companies and cause many to rethink how to manage their businesses. “Rising material costs make it difficult to meet consumers’ needs,” said one, while another noted the “choke-hold on production” supply chain issues caused. “The projects are still coming in, but the challenges to get materials, produce and deliver are still prevalent, meaning at some point capacity will hit a ceiling.”
Geographic markets with the most growth in 2021
- Southeast 43%
- Southwest 26%
- West 21%
- Midwest 17%
- Northeast 15%
The seeming permanence of working from home and strong housing and remodeling demands were among the most-cited reasons companies gave for increased demand. One Florida-based manufacturer said, “The ‘work from home’ mentality is driving new construction and remodeling not only in Florida, but across the country. People are spending more time in their homes and therefore wanting to invest more in them.”
Anticipating business investments in 2022
- Employee recruiting and retention: 84%
- Equipment updates: 82%
- Software updates: 55%
- Introduce new products: 55%
- R&D/testing: 43%
- Marketing: 41%
- Expand locations: 27%
- Other: 7%
The work from home trend also allows families to relocate without sacrificing existing jobs. “The residential construction market is growing due to housing shortages in most major markets,” says another manufacturer. “The pandemic also had an impact on housing, sparking many individuals and families to move into new homes or relocate to new areas due to more prevalent remote work opportunities.”
Anticipating major headwinds in 2022
- Material cost: 78%
- Inflation: 76%
- Labor shortage: 64%
- Material availability: 64%
- Logistics: 42%
- Backlogs: 29%
- Evolving product designs: 9%
- Policy: 7%
- Coronavirus restrictions: 7%
- Tariffs: 4%
- Other: 4%
Labor and Automation
Biggest labor challenge
- Recruitment: 46%
- Retaining: 45%
- Training: 42%
- Other: 23%
79% of respondents had more difficulty finding workers in 2021 compared to 2020
Several manufacturers noted how many come from outside the industry and have little to no relevant manufacturing experience. Training is also difficult, especially when demand is so high. “Training requires the attention of a supervisor or other worker to train the new employee. Being busy makes that difficult to do without impacting current production rates,” said one manufacturer. Many manufacturers also commented that retention is a problem, with many people leaving quickly, further constraining the ability to properly train.
Several manufacturers said added overtime and flexible shifts have helped ease labor challenges. One noted, however, to be careful with overtime because of the potential of reduced job satisfaction and even greater retention difficulties.
Benefits of automation
- Increased output: 68%
- Increased quality: 65%
- Labor savings: 59%
- Cost savings: 35%
- Operational transparency: 32%
- Other: 11% (includes reduced waste and easier training)
84% employ automation at their factory; 66% plan to add automation in the coming year.
Materials & Supply Chain
100%
Report material price increases at average of 29%
70%
Made changes to their supplier partners
66%
Source materials internationally
Materials and Supply Chain
Backlog depth
- 1-2 weeks: 2%
- 2-4 weeks: 12%
- 4-8 weeks: 19%
- 8-12 weeks: 29%
- 12-16 weeks: 23%
- Longer: 15%
49% report a longer backlog compared to last year; 27% a shorter one.
Supply chain remains a widespread concern across all industries. Survey respondents offered some of their best practices for keeping upstream and downstream supply chains operating.
- Ordering earlier
- Increasing inventory levels
- Managing customer expectations
- Being flexible
- Multi-source
- Consistent communication with suppliers and customers
Clear customer communication and transparent, efficient operations are especially critical during a time of price volatility and increases. “We have looked for ways to operate more efficiently to allow for us to absorb price increases from our suppliers, rather than forward them onto our customers,” said one respondent. “We are also picking up on additional market share from competitors.”
Most challenging materials to source
- Hardware and components: 72%
- Aluminum: 41%
- Glass: 39%
- Vinyl: 37%
- Laminate: 22%
- Wood: 13%
- Paint: 9%
- Chemicals: 6%
- Other: 9% (includes weatherstripping and sealants)
70% of respondents made changes to their supplier partners in the past year
Many companies added suppliers for products they already use, primarily out of necessity because of lack of availability with existing suppliers and so they can reduce long lead times and ensure material availability. One survey respondent said multi-sourcing “allows us to stay competitive with both price and lead time.”
74% have strategic alliances with their suppliers
Strategic alliances have given some manufacturers increased assurance of timely shipments and volume and help with consistent, open lines of communication. “Establishing healthy partnerships and relationships are extremely important in our industry,” wrote one survey respondent. “Unlike in a down market, suppliers today have a nearly unlimited choice with which customers to service so the biggest benefits of having alliances, partnerships, etc., is that it enables higher levels of service and open/honest dialogue when challenges occur.”
70% of companies have been on allocation for materials by their suppliers
Window and door manufacturers are tackling this challenge by submitting blanket orders, sourcing from other suppliers, making product changes when possible and sometimes just waiting for the supplies.
“We have worked to adapt to this by constantly striving to be as flexible as possible, often thinking outside of the box,” shares one manufacturer. “Interlayer, a critical component for impact product, remains in short supply across the market. Normally our company uses interlayer in roll form that is specifically optimized for our exact production lines and processes. Due to the various market shortages, we had to be flexible and switch to using various sizes of rolls and sheet just to keep the production lines running. We also have been striving to control more supplies internally and try to rely less on glass suppliers by utilizing our internal glass assets to supplement underperforming glass suppliers. We also spent significant time with our extruders to determine ways to change profiles in order to support them with efficiency gains during the extrusion process. This activity didn’t lead to cost savings, but allowed the supplier to push more metal for us throughout their production runs. Lastly, we have been placing a lot of focus and energy on single-sourced parts and digging deep into our suppliers’ supply chain to identify risk potential.”
Products
Product features asked for by customers
- Customized products (includes color, hardware, options, finishes): 84%
- Energy-efficient products: 82%
- Larger windows/doors: 76%
- Impact-rated products: 42%
- Sound abatement: 38%
- Historically accurate products: 24%
- Other: 6%
About 70 percent of survey respondents manufacture vinyl windows and/or doors, again making vinyl the most ubiquitous material worked with, but manufacturers of all materials and product types, including wood, aluminum, fiberglass and more, share the common goal of manufacturing products to meet customers’ needs and market demand.
Product updates anticipated in response to new Energy Star 7.0 guidelines
- Triple-pane: 71%
- Gas fill: 57%
- Skinny triples: 20%
- Dynamic glass: 17%
- Thermally broken aluminum: 23%
- Other: 29% (includes spacers, foam fill, glass coatings and a larger IG pocket)
73% plan to update products as necessary
Fenestration and Glazing Industry Alliance Market Study
Prime Window Growth
- 2021: 8.8%
- 2022: 5% (projected)
- 2023: Flat (projected)
- 2024: -5% (projected)
Remodeling and Replacement Window Growth
- 2021: 5%
- 2022: 5% (projected)
- 2023: 3% (projected)
- 2024: 2% (projected)
Entry door growth
- New construction: 8%
- R&R: -2%
- Total market: 2%
- Continued growth projected through 2024
Residential skylight growth
- 2021: 6% increase in shipments compared to 2020
Source: Fenestration and Glazing Industry Alliance 2021/2022 Study of the U.S. Market for Windows, Doors and Skylights
The Top Manufacturers Index
The Top Manufacturers list details North America’s largest manufacturers of residential windows, doors, skylights and related products, based on sales volume
*Sales are estimated based on research; figures not provided by company

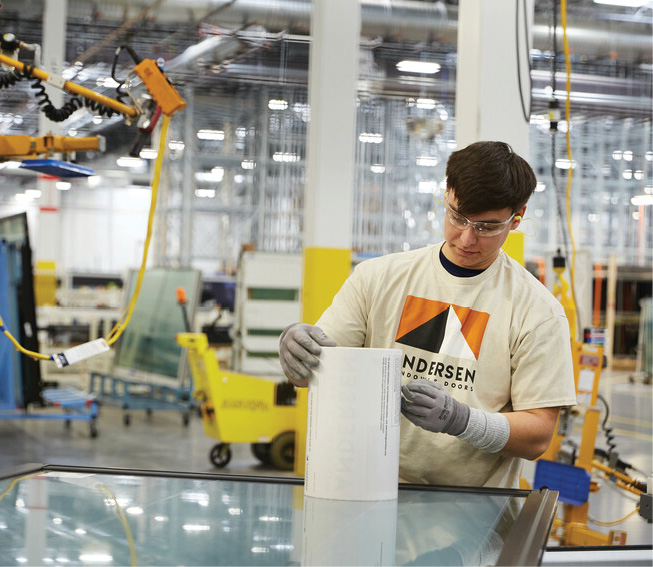
More than $1 Billion
- Andersen Windows & Doors
- Cornerstone Building Brands
- Jeld-Wen
- Marvin Windows and Doors*
- Masonite
- MITER Brands
- Pella Corp.*
- PGT Innovations
- Velux USA*
$500 Million to $1 Billion
$300 Million to $500 Million
- Associated Materials*
- Harvey Building Products
- Novatech
- Sierra Pacific Windows
- Steves & Sons Inc.
- Woodgrain Millwork*
$200 Million to $300 Million
- Champion*
- Kolbe & Kolbe Millwork Co.*
- Polaris Windows & Doors*
- ProVia*
- Quaker Windows and Doors
- United Window & Door Mfg.
- Weather Shield Mfg.*
$100 Million to $200 Million
- All Weather Windows*
- Boral Windows LLC*
- Crystal Window & Door Systems
- Lindsay Windows
- Loewen Windows and Doors
- Plastpro
- Trimlite
- Trinity Glass International*
- Vinylmax Windows
- Wincore Windows and Doors
- Window Designs Group*
$75 Million to $100 Million
- Air Master Windows and Doors
- Elevate Windows and Doors
- Midway Windows & Doors
- Simpson Door Co.
- Thompson Creek Window Co.*
- Viwinco Inc.
- Wallside Windows
- WinDor
- Window Mart*
- Vytex Windows
$50 Million to $75 Million
- Arcadia Custom
- Builders FirstSource*
- Castle Windows*
- Conservation Windows*
- Durabuilt Windows & Doors*
- Earthwise Group LLC
- Fenplast*
- Gerkin Windows and Doors
- LePage Millwork*
- Lincoln Windows & Patio Doors
- Lux Windows and Doors*
- North East Windows USA Inc.
- Tru Tech Doors*
- ViWinTech Window & Door Inc.
$40 Million to $50 Million
- ATI Windows
- Centra Windows
- Croft LLC*
- Hayfield Window & Door Co.
- Hope’s Windows Inc.*
- International Window Corp.
- Mathews Brothers Co.
- NT Window Inc.
- Okna Windows Manufacturing*
- Solaris International*
- The Coeur d’Alene Window Company
- YKK AP America Inc.
$30 Million to $40 Million
- All Weather Architectural Aluminum*
- Comfort View Products
- Frontline Building Products*
- GlassCraft Door Co.
- Madero
- Stanley Doors*
- Taylor Entrance Systems
- Thermal Windows Inc.*
- Vector Windows & Doors
$20 Million to $30 Million
- Everlast Group of Companies
- Gilkey Window
- Ideal Window
- Inline Fiberglass Ltd.*
- Interstate Window & Door Co.
- Joyce Manufacturing Co. Inc.
- Moss Supply Co.
- Sun Windows Inc.
- Vinyl Kraft Inc.
- Winchester Industries
$15 Million to $20 Million
Less Than $15 Million
- Alpen High Performance Products
- Burris Windows*
- Euro-Vinyl Windows
- Glass-Rite
- Glo European Windows
- Seaway Mfg. Corp.
- Solar Innovations*
- Stewart Brannen Millworks
*Sales are estimated based on research; figures not provided by company
The Top Manufacturers List
The full Top Manufacturers list details North America’s largest manufacturers of residential windows, doors, skylights and related products, based on sales volume. The list includes more information about product lines and is available in the May/June issue of Window + Door Magazine.